Mobile app tracking (how to install + best tools)
January 30, 2023
You’ve just launched your product and got some good traction.
Your download rates are high and the user base is growing, but you aren’t sure what’s fueling those traffic spikes, spending sprees, and churn rates.
Mobile app tracking tools help you answer questions about app usage patterns, mobile marketing campaign performance, and app monetization strategies.
The Value of Mobile App Analytics
Analytics helps understand:
How users perceive and use your mobile app
What makes them complete onboarding
Which features are helpful or annoying
What makes them abandon your product
Tracking in-app behaviors helps identify problematic user flows and improve UX. This, in turn, helps improve user retention, which remains at a painful 13.3% on average for mobile apps.
Separately, mobile app analytics supplies you with valuable data for advertising.
If you decide to monetize your app, you’d need to supply transparent metrics on user engagement, growth, demographics, etc., to a selected ad network or sponsor.
Likewise, tracking how your user acquisition, retention, and app revenue change after different ad campaigns is crucial for minimizing budget waste.
Must-Have Mobile App Tracking Tools
There are many tools for mobile app analytics.
You’ve got plenty of native and third-party products for monitoring app usage patterns, technical performance, in-app purchases, and other product usage patterns.
You can transform plenty of user intel into new app requirements for version updates.
That said: You must collect user data responsibly in line with GDPR Act in the EU and CCPA in the US. Always request consent to mobile app tracking and inform users about the intended data usage scenarios.
Now let’s dive into your options.
Native Mobile Apps Analytics Tools
Apple and Google provide free app analytics for iOS and Android apps. Install both to get comprehensive insights about your app performance in the app stores.
Firebase
Mobile app developers know Firebase as the native platform for building Android apps. Apart from providing an integrated development environment, SDKs, and other helpful coding tools, Firebase also has various analytics features to:
Monitor user adoption rates.
Find and fix app performance issues.
Run A/B tests for in-app messaging, advertising banners, etc.
Firebase also seamlessly integrates with Google Analytics for mobile apps. With GA, you can get even more demographic data about app users, analyze their product usage patterns, visualize common navigation paths, and get many other customized reports.
How to Configure Google Analytics in Firebase
To start using Google Analytics 4 in Firebase:
Enable GA access in your Firebase project settings.
Add analytics SDK to your app.
Start logging events with the logEvent() method.
The setup process is a bit technical and requires a few lines of code. So ask your mobile app developers to help.
Note: You can also add Google Analytics to iOS apps. The setup process is similar.
Apple App Analytics
Apple App Analytics is a free set of analysis tools for the iOS ecosystem. Similar to Firebase and GA, Apple provides insights into your app performance in the App Store. You can:
Find out if people continue to use your app and view the number of installations, sessions, and active devices.
Figure out why users drop by analyzing crash and deletion data by platform, app version, and OS version.
Check the number of unique paying users over time across regions and currencies
and filter in-app sales by the source to determine the impact of your ad campaigns.
On top, Apple also reports on other product metrics, such as in-app events. These reports help you understand if your in-app marketing makes a significant impact or not.
How to Install and Configure Apple App Analytics
Use App Store Connect to install App Analytics — the same services you use for submitting iOS mobile apps to the app store.
After your app passes the review and gets published in the App Store, you’ll also get access to App Analytics. No special installation is required!
Mobile App Tracking Tools
Native analytic products provide essential information about your app’s performance. Yet, neither is a fully comprehensive tool.
So if you want to get more options for advanced user segmentation, marketing campaign attribution, and conversion optimization, pick a complementary tool.
Flurry
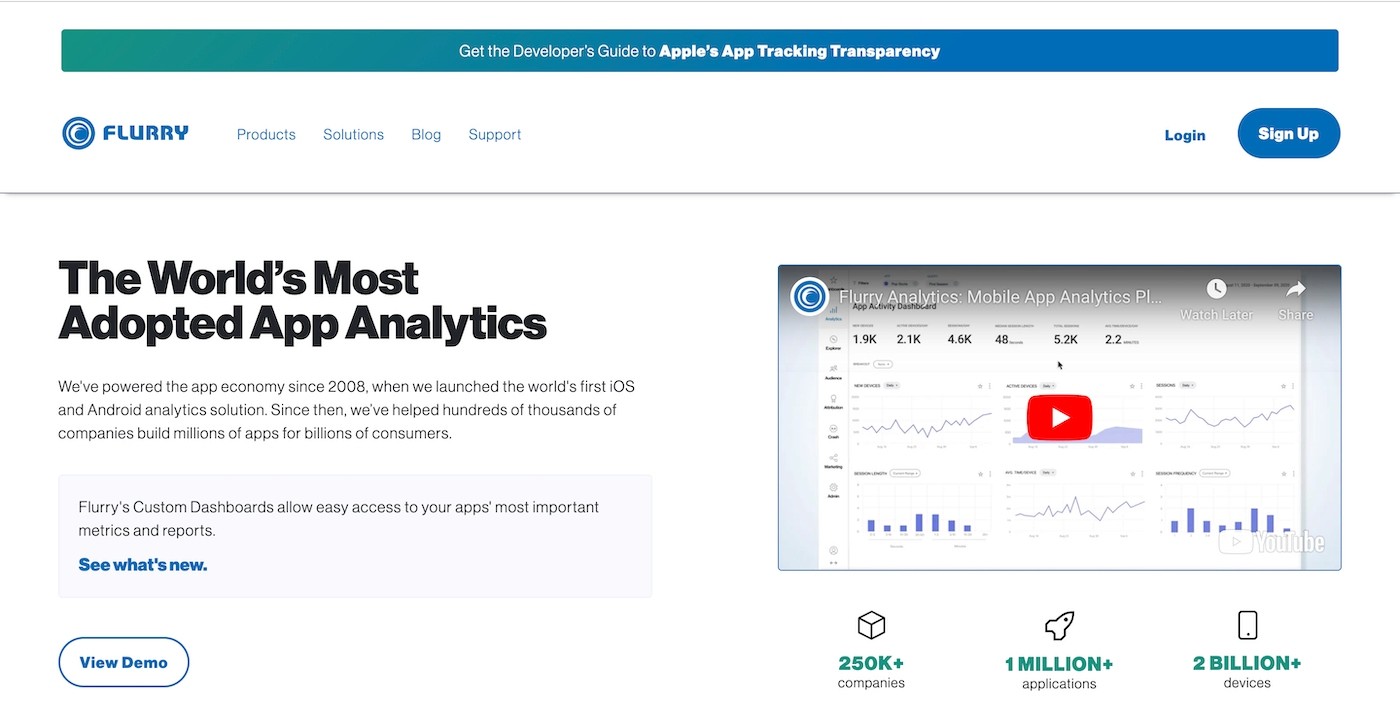
Flurry has been helping app entrepreneurs maximize their revenue since 2008.
This premium mobile app analytics platform comes with data-rich dashboards and custom reports for every stage of the product growth journey.
With Flurry, you can:
Obtain data about key demographics (age and gender), affinities (interest category), and geographics (location).
Export audience data to build lookalike profiles for promoting your app on an advertising network.
Track different user cohorts to understand how product changes affect user loyalty, engagement, and spending patterns.
Attribute new users to specific channels and campaigns with high precision, then optimize your referral sources and campaigns.
Slice and dice your conversion funnel to pinpoint when users drop off and optimize accordingly.
Overall, Flurry is the optimal choice for mobile-first companies looking to improve their product adoption and revenue generation rates.
Kochava
Kochava is a mobile measurement partner (MMP) — a solution that tracks, organizes and visualizes mobile app data from multiple channels.
Its main pitch: Provide you with a unified view of your campaign performance across all channels and partners.
Kochava also offers one SDK for integrating thousands of media partners into your product without hindering app performance.
With Kochava, you get:
Privacy-centered user ID solution that’s not dependent on cookies. Use it to identify and track user interactions across devices.
Effectively attribute each cent spent on marketing to owned and paid media channels (including connected TV, digital out-of-home ads, and linear TV).
Get offline campaign measurements from Kochava’s partners, such as Cuebiq and Clear Channel Outdoor.
Cost data aggregation tool consolidating your spending across channels into a single comprehensive report.
Advanced CLV measurement through aggregated earnings from digital ads, in-app purchases, subscriptions, and paid downloads.
Use Kochava to track users across properties without invading their privacy and get rich insights about your return on ad spend (ROAS) on online and offline channels.
AppsFlyer
AppsFlyer is a freemium mobile app tracking product offering a good balance of simplicity with sophistication.
The product has similar features for app attribution, audience analytics, segmentation, and engagement.
Plus, several more unique features:
Omnichannel customer measurement across mobile, web, and connected TV apps with accurate device identification.
Aggregated cost analysis dashboards showing how to spend your marketing budgets best.
Predictive analytics into customers’ lifetime value enables you to confidently optimize your campaigns.
Deep linking attribution app for creating custom URLs to track users across all major marketing channels.
Advanced anti-fraud ad protection to prevent your mobile marketing budgets from falling into the wrong hands.
AppsFlyer also has a marketplace of some 10,000 integrations which let you connect to other business products (from ad networks to customer data platforms) via one SDK.
Mobile User Behavior Analytics Tools
Using user behavior analytics solutions, you can discover your most valuable users and how they interact with your product.
Improve your app adoption rates with visual and data-driven analytics and complementary tools for user journey orchestration offered by the following three platforms.
UXCam
UXCam provides a detailed glimpse into users' behaviors through visual insights. By observing users in real-time, you can get helpful insights for improving your app prototype, validating your app design during beta testing, and fixing overlooked UX goofs post-release.
With UXCam, you can:
Discover the “why” behind feature usage patterns and everyday user interactions through session replays.
Determine what tickles users’ attention with heatmaps.
Locate common drop-off points and fix navigation paths with screen flow analytics.
Find and fix app crashes, bugs, and UI freezes.
Set up and closely observe event-based funnels to patch up different user flows.
Ultimately, UXCam can help your design team answer questions about typical user journeys, product usage patterns, and sources of negative feedback.
Mixpanel
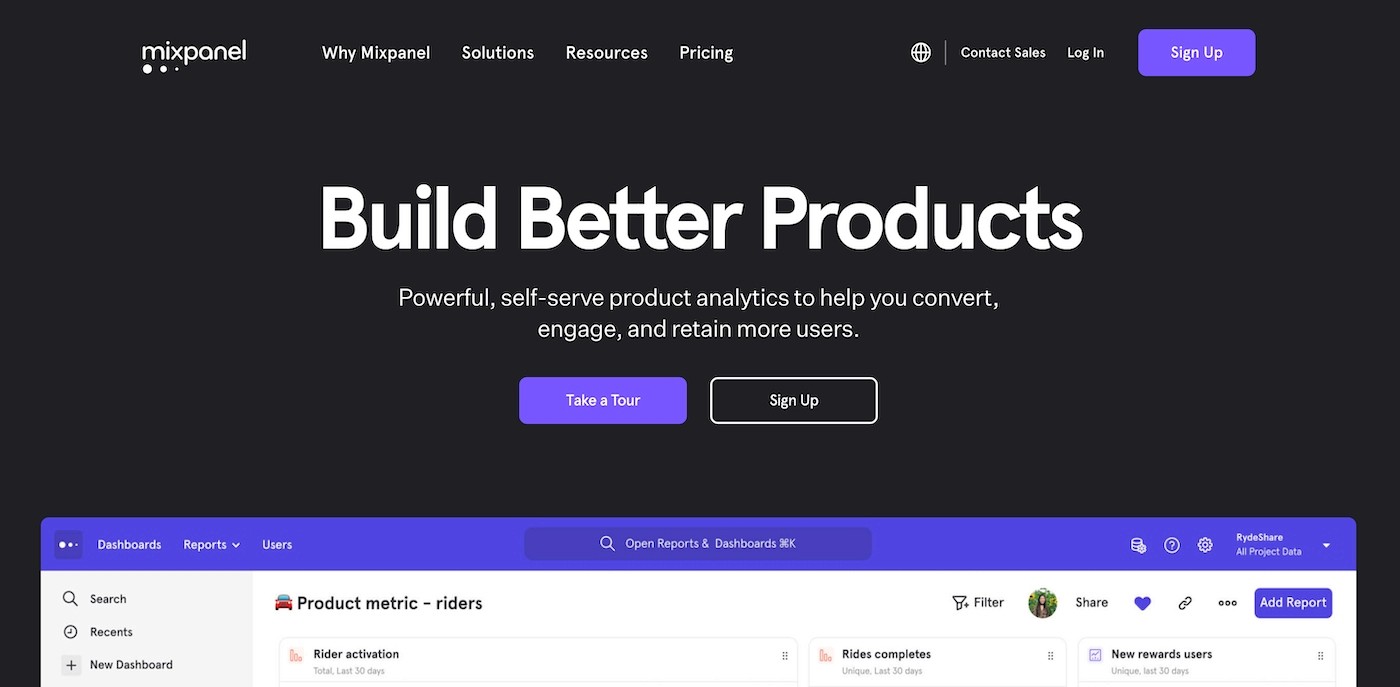
Mixpanel is a well-known name in the product analytics space.
The app provides high-fidelity, quantitative and qualitative insights about app adoption trends, user engagement, and current retention levels.
Mixpanel puts a powerful magnifying glass over:
Root causes of user drop-off at every funnel step.
Conversion drivers and blockers by audience segment, traffic source, or in-app event.
Common paths to increasing customer loyalty and in-app purchase volumes.
Arguably, the best boon of Mixpanel is limitless segmentation, which uses your own custom metrics, dimensions, and KPIs to identify your most valuable users, traffic sources, and campaign types.
CleverTap
CleverTap positions itself as an omnichannel customer engagement platform. Though its core offering remains a robust mobile app analytics tool powered by contextual insights and powerful AI/ML models.
CleverTap features include:
Analytics tools for visualizing user retention trends, assessing feature stickiness, and identifying the best acquisition strategies.
Visual campaign builder for designing onboarding, promo, and re-engagement sequences.
Automated user segmentation for building precise targeting campaigns by action, inaction, or specific user parameters.
Data-driven marketing optimization tools for in-app messages, push notifications, and email coms.
CleverTap also offers a messaging suite to run cross-channel promo campaigns via SMS, WhatsApp, App inbox, email, and push notifications.
Mobile Marketing Analytics Tools
Native mobile marketing apps like Firebase and Apple App Analytics provide app marketers with baseline metrics, e.g., app downloads, popular features, and daily/weekly/monthly users.
But they don’t give much details about your users’ in-app actions and behaviors on other channels. Successful app marketers use a more advanced tool to get these details.
Localytics
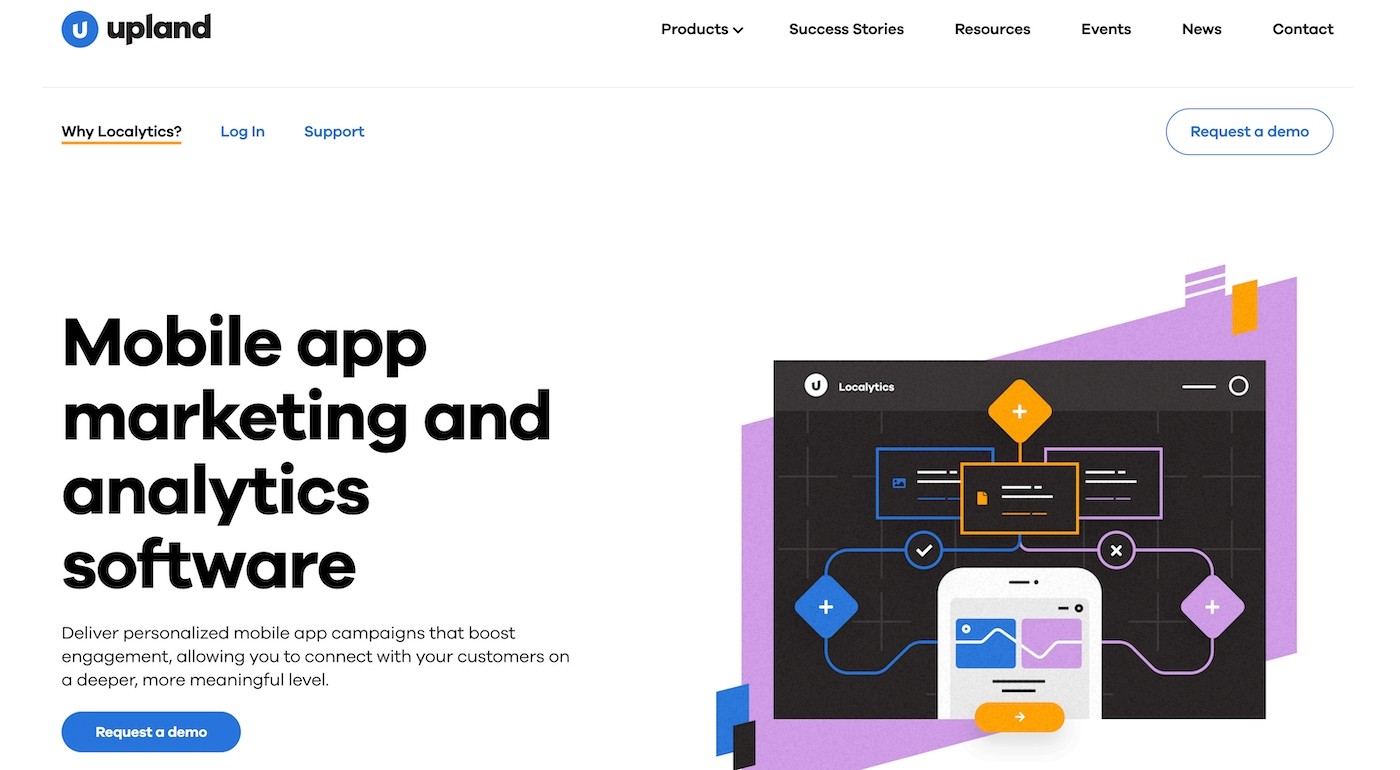
Localytics (now part of Upland Software) can collect and process up to 12 million data points per app. Then present all the findings as convenient, multidimensional reports. Discover what app features, promos, and services resonate with your customers to maximize ROI and iterate on product improvements.
Localytics provides:
In-depth trend reports with data on retention, conversions, churn, and uninstall rates.
Predictive analytics tools for identifying customers at risk of churn.
Access to industry benchmarks data to stack your product performance against other mobile apps.
Segment reports using layers of the profile, behavioral and historical data for meaningful personalization.
Overall, Localytics is particularly well-suited for retail, financial, telecom, travel, and hospitality mobile apps.
AppMetrica
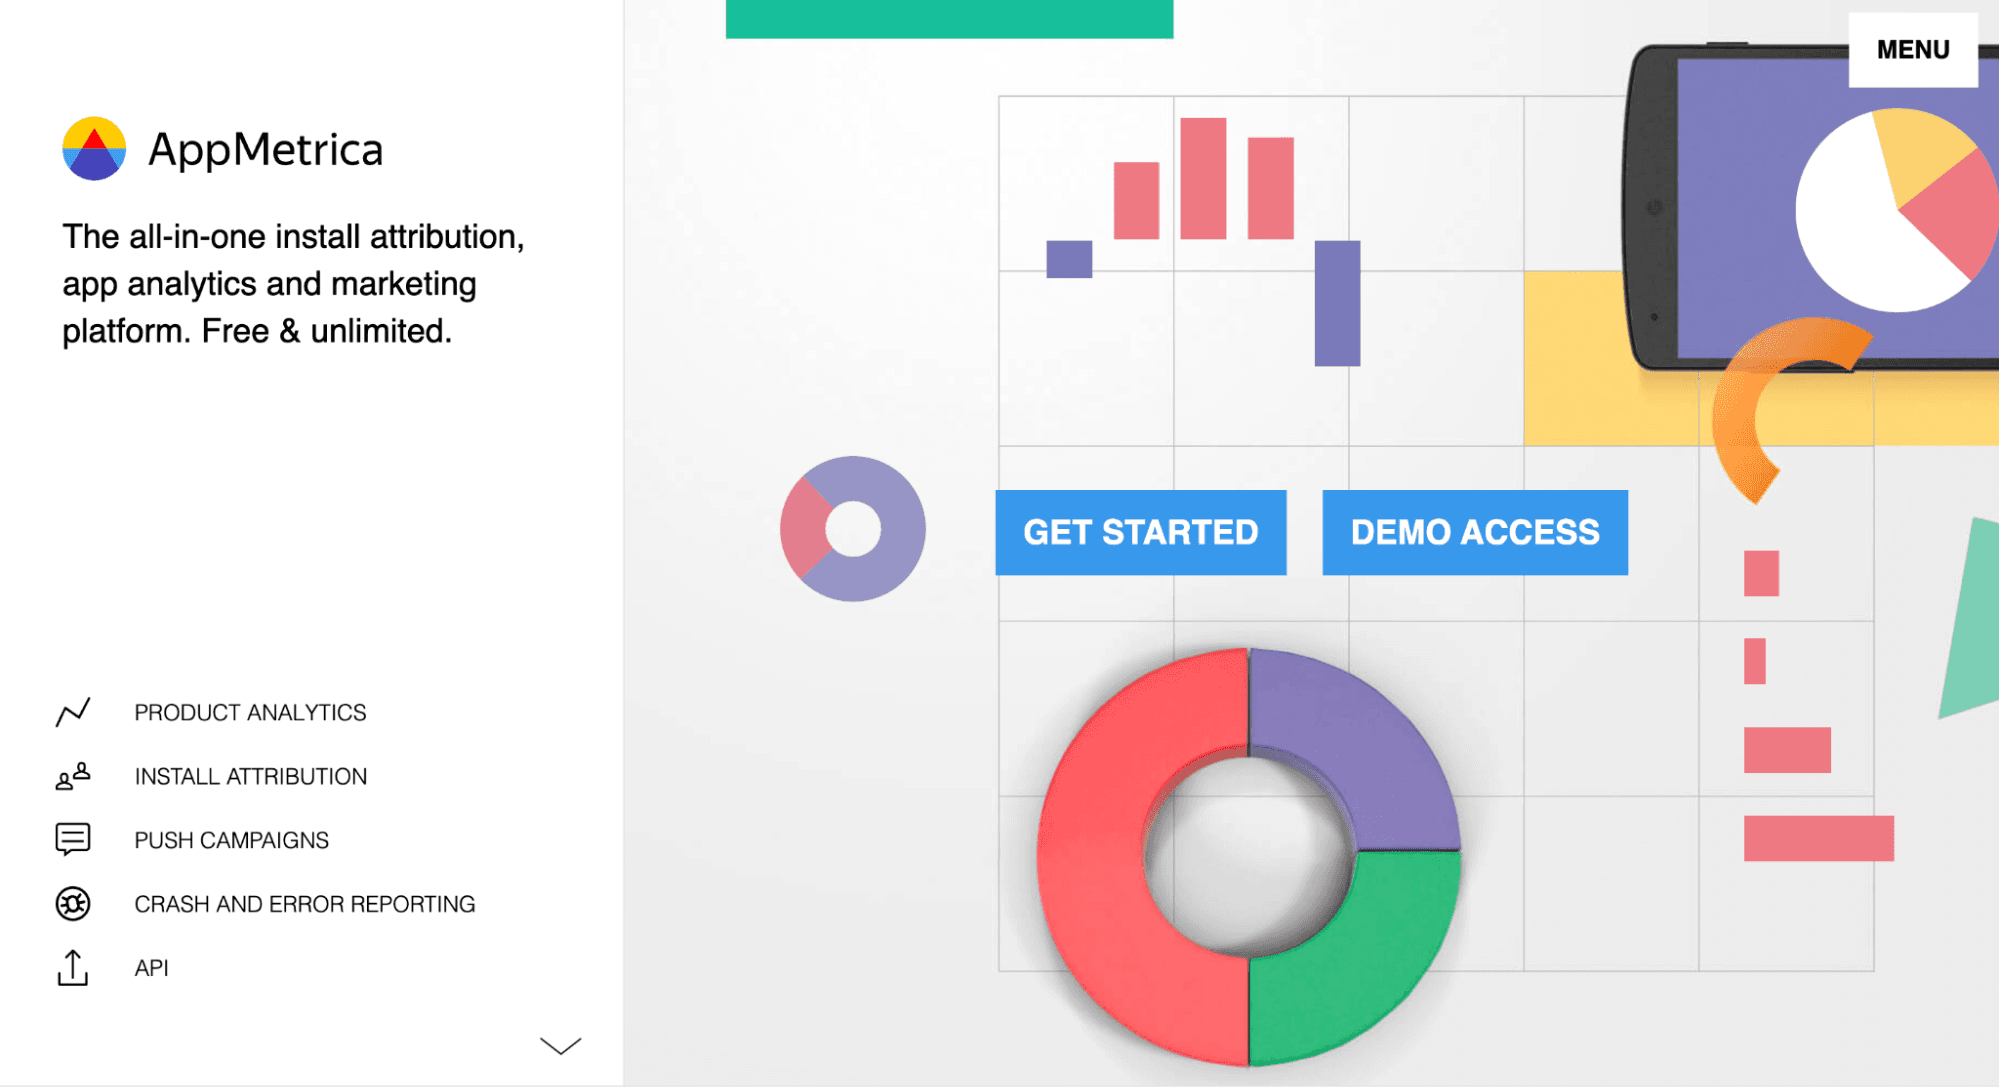
AppMetrica is a free app analytics tool touting a great collection of tools for install attribution, push notification management, crash reporting, and product analytics.
The above suite is available for native (Android & iOS), hybrid, and cross-platform mobile apps.
Key features and reported metrics:
Real-time data on daily/weekly/monthly active users.
In-app events data with the ability to add custom event dimensions.
In-depth user profiles based on collected data.
App revenue reporting: ARPU, average order value, repeat purchases, and more.
Campaign attribution using multiple parameters – Device ID, Referrer, and Fingerprint.
Accurate tracking for remarketing campaigns.
Secure data management and exports using Logs API.
AppMetrica also has an excellent toolkit for running in-app push messaging campaigns. You can use available insights to design, schedule, split test, and run personalized marketing campaigns and get detailed stats on their performance.
Data.ai (formerly App Annie)
Data.ai (that some also remember as App Annie) is one of the first (and arguably best!) tools for mobile app competitor analysis.
Though today, their product morphed into an AI-driven consumer and market data intelligence platform. The good news? Data.ai still has a free tier. Bootstrapping entrepreneurs can use it to determine how others became successful and what action to take to improve their app performance.
Here’s what makes Data.ai a great tool:
Detailed feature matrix reports to identify your competitors' product capabilities. Use the data to shape your product backlog and prioritize new feature development.
Mobile market analytics data with trend reports on emerging opportunities, threats, and shifts in user interactions.
Discover app features driving monetization, stickiness, and customer loyalty for other apps.
Purpose-built reports, market intelligence, and analytics tools for gaming apps.
Data.ai also recently released the first in-app purchase analytics for SKUs. You can now learn which products sell out best from your competitors in different countries and determine how consumers respond to specific price points.
Final Thoughts
When selecting mobile analytics tools, think about your current priorities.
Do you want to fix a leaky user onboarding sequence, control ad spending, or get better tools for in-app campaign optimization?
Many of the above tools have overlapping features, but some are better than others regarding ROAS, CLV, or behavioral analytics. So shop around and compare your options.
